
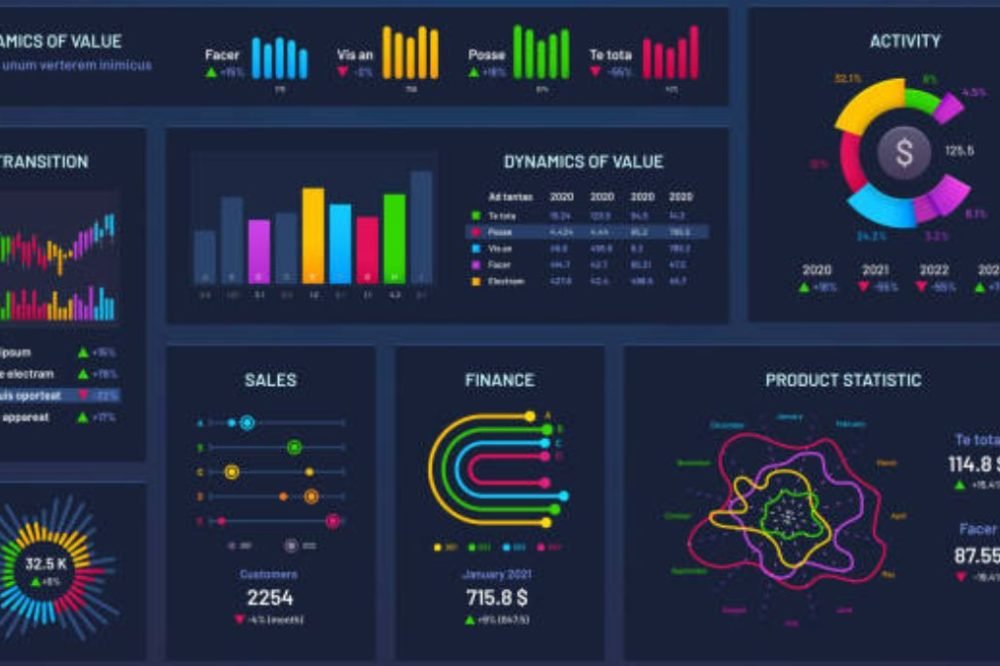
Power BI dashboards are one of the most effective tools to transform raw data into usable business intelligence. A well-designed dashboard provides executives, managers, and analysts with a real-time view of the indicators that matter-revenue trends, customer behavior, operational performance, and financial health-all on a single visual, interactive screen. But for the uninitiated, the road from raw data to a slick, interactive dashboard can be a daunting one.
In this step-by-step article we lead you through exactly how to construct dashboards in Microsoft Power BI from scratch – connecting data, data modeling, report creating, dashboard building, sharing. Whether you’re constructing your first dashboard or want to improve your current Power BI skills, this tutorial provides a practical approach.
What is Power BI? Why use Power BI?
Microsoft Power BI is a business intelligence and data presentation platform that integrates hundreds of data sources, transforms and models data, and generates interactive reports and dashboards. It resides within the Microsoft 365 ecosystem, integrating seamlessly with Excel, Azure, SharePoint and Teams.
Power BI is part of a category often dubbed business intelligence software or visualizing data tools, including Tableau, Looker, and Qlik. Its main benefits over the competition are the native integration into the Microsoft ecosystem, the low cost (plenty of free tier and affordable Pro plans), and the Excel-like interface that reduces the learning curve for customers acquainted with Microsoft tools.
Power BI Components You Should Know
Before developing dashboards, it is important to grasp the three key components of Power BI:
Power BI Desktop – the free Windows tool you use to connect to data, develop data models and create reports. This is where a lot of the work takes place.
Power BI Service (app.powerbi.com) is the cloud-hosted online application where you publish reports, create dashboards, share with colleagues, and configure data refresh schedules.
Power BI Mobile – mobile apps (iOS, Android) to view and interact with dashboards on the move.
Workflow: Build on Desktop, Publish to Service, Share via Service, View anywhere including Mobile.
Step 1: Configure Power BI Desktop
You may download and install Power BI Desktop free on Windows. Available at:
- Microsoft Store (search “Power BI Desktop”) – recommended, auto-updates
- Microsoft Download Center (powerbi.microsoft.com/desktop)
Sign in using your Microsoft account or your work or school account after installation. Desktop does not require any paid license to be used – all report and data modeling capabilities are available in the free version.
System requirements Windows 10/11 or Windows Server 2016+, 2GB RAM (8GB preferred), 2.4GHz processor, 1.5GB accessible disk space.
Step 2: Connect to Your Data Source
Power BI offers native connectivity to over 100 data sources. Open Power BI Desktop and on the Home ribbon, select ‘Get Data’.
Popular Data Sources for Beginners
- Excel files – the most common entry point. Click Get Data → Excel Workbook → browse for your file → select tables or sheets to import.
- CSV/Text files – Get Data -> Text/CSV -> browse to your file. Power BI automatically detects column types and delimiters.
- SQL Server – Get Data → SQL Server → enter your server name and database → select Import or DirectQuery mode.
- SharePoint – Get Data > SharePoint Online List or SharePoint Folder > Enter the site URL > Select your lists or files.
- Web – Get Data -> Web -> Enter URL Power BI can scrape tables from online pages and connect to web based data sources.
- Power BI Datasets – link directly to datasets your organization publishes to Power BI Service to keep reports consistent.
Import Mode vs DirectQuery Mode
- Import mode – Imports the data into Power BI’s in-memory engine. Best performance, offline, data is a snapshot (refreshed on schedule, not live).
- DirectQuery mode – queries the source database in real-time. Always displays current data, although performance is dependent upon how fast the underlying database is and how sophisticated the query is.
For most dashboard projects, import mode is the best place to start. Only use DirectQuery if you need real-time data and your database can support the query load
3. Power Query: Mold Your Data
When you connect to your data source, Power BI opens Power Query Editor, a data transformation tool that enables you to clean, restructure, and combine your data before you put it into the model.
Power Query Transformations You Must Know
- Remove columns – If you need to remove data you don’t require, then right-click the column headers and select Remove Column. By keeping only necessary columns, we may enhance model performance.
- Rename columns – double-click the column headers to rename columns to business-friendly names. “Customer ID” is now “cust_id” “Revenue” is now “rev_amt”
- Change data types Power BI automatically detects data types but occasionally makes mistakes. Manually set Text, Full Number, Decimal Number, Date, or other types by clicking the data type icon in each column header.
- Filter rows – click on the dropdown arrow on any column to filter away irrelevant rows – test records, blank rows, or historical data not within your analysis period.
- Split Columns – If a column has many values (full name, address) use Transform → Split Column to separate them.
- Combine data from various tables (e.g. SQL JOIN) – Union queries Go to Home → Merge Queries → pick the related column in each table.
- Append queries – merge rows from many tables with the same structure (January, February and March sales files into one table).
Best Practice: Do Not Edit Source Data
Power Query edits are non-destructive; your original data files are never changed.
Each morph is saved as a step that you can alter, reorganize, or delete. This provides Power Query with a secure, auditable transformation layer between your raw data and your data model.
When transformations are complete, click Close & Apply to load data into the Power BI data model.
Step 4: Building Your Data Model
The data model is the heart of any Power BI dashboard. A model that is correctly designed will let you write reports quickly and efficiently, while a poorly designed model will lead to errors, inaccurate calculations, and performance problems.
Understanding Relationships
If your data is coming from different tables you need to establish the relations between them. To view your tables and their relationships, go to Model view (the diagram icon in the left sidebar).
To construct a relationship, drag from the key column in one table to the matching column in another. For example, drag from the CustomerID column in your Sales database to the CustomerID column in your Customers table.
Types of relationships:
- One-to-many (1:*) – one consumer may have several sales records. Most prevalent sort of relationship.
- Many-to-many (:) – use with caution. Careful model design is required to prevent ambiguous outcomes.
The Star Schema The Gold Standard Model Design
The ideal Power BI data model is a star schema, a single fact table (where you store your measures of activity: sales transactions, support requests, website visits) surrounded by dimension tables (where you store descriptive attributes: customers, products, dates, locations).
This arrangement is termed a star because the diagram looks like a star – the fact table in the middle with dimension tables shooting out. It gives the best combination of query performance, computation accuracy and report flexibility.
Building a Date Table
Business dashboards almost always require time intelligence – how this year compares with previous, rolling 12-month trends, month-to-date totals. Power BI’s time intelligence capabilities (DATESYTD, SAMEPERIODLASTYEAR, DATESINPERIOD) require a suitable Date table linked to your fact table.
One utilizing DAX in the Modeling ribbon:
dax;
Date = CALENDAR (DATE (2020, 1, 1), DATE (2026, 12, 31))
Then add columns for Year, Month, Quarter, Week and Day Name using DAX calculated columns. (Table Tools -> Mark as Date Table) Mark this table as a Date table and relate it to the date column of your fact table.
Step 5: Build Measures using DAX
DAX (Data Analysis Expressions) is the formula language used in Power BI to create calculated measures, which are dynamic calculations that respond to filters and slicers in your reports.
Measures are different from calculated columns . Measures are calculated based on the current filter context (i.e. what you pick on the report) whereas calculated columns are computed once when the data is imported.
Essential DAX Measures for Dashboarding
Total Revenue:
dax
Total Revenue = CALCULATE(SUM(Sales[Revenue]))
Revenue, Last Year:
dax
PY Revenue = CALCULATE([Total Revenue], SAMEPERIODLASTYEAR(Date[Date]))
Year on Year Growth:
dax
YoY Growth % = DIVIDE([Total Revenue] – [PY Revenue],[PY Revenue],0)
Running Total:
dax
Running Total = CALCULATE([Total Revenue],DATESYTD(‘Date'[Date]))
Number of Customers:
dax
Customer Count = COUNT(DISTINCT Sales[CustomerID])
Average Order Value:
dax
Avg Order Value = DIVIDE([Total Revenue],COUNTROWS(Sales),0)
Creating Measures Go to the Home ribbon → New Measure → enter your DAX formula. Calculator icon appears in Fields pane for measures
Step 6: Design Your Report Pages
Now that you loaded data, built relationships and created measurements, you are ready to develop report pages. Visuals reside in reports in Power BI. Dashboards in Power BI Service are made up of report visuals that have been pinned.
Visualizations
In Report view, drag fields from the Fields pane to the canvas, or select a visualization type from the Visualizations pane and then drag fields to the appropriate wells (Axis, Values, Legend, etc.
Core visualizations for business dashboards:
- Card – shows a single KPI number. Drag a measure to a Card visual to show a metric in a clean, conspicuous way. Best for Total Revenue, Number of Customers, Average Order Value
- Bar/Column Chart – To compare values of different categories. Vertical bar charts (column charts) are good for time series; horizontal bar charts are good for rating comparisons.
- Line Chart – shows trends over time. Connect to your Date table for automatic drill-through of date hierarchies (Year → Quarter → Month → Day)
- Pie/Donut Chart – Show portion to complete relationships. pie charts can’t be read with more than 5-6 categories, use them sparsely.
- Table and Matrix – View detailed data in tabular form. Matrix visualizations permit grouping rows and columns like Excel pivot tables.
- Map – visualize geographic data . Add a location field (city, country, postal code) to plot data automatically on an interactive map.
- Slicer – interactive filter control Add a Date slicer to filter by time, a Region slicer to filter by geography, or a Product slicer to filter by category. Slicers are filters that apply to all visuals on the page at once.
- KPI Visual – displays a metric and its trend indicator (up/down arrow) against a target. Great for performance-against-goal tracking.
Best Practices for Report Design
- Utilize a visual hierarchy. Place your most critical KPI cards on top, trend charts in the middle, and detailed tables at the bottom. The eyes of the viewers move in a top-to-bottom left-to-right pattern naturally.
- Limited colors. Your main brand color can be used for key metrics, and a neutral gray for supporting information. You don’t want a different hue for each data series; that’s just visual noise, not insight.
- Line everything up. Use Power BI’s Format → Align capabilities to perfectly align graphics. Dashboards look amateurish if things are not lined up.
- Use the same font sizes. Pick two or three font sizes and stick to them – one for KPI numbers, one for chart titles, and one for labels.
- Add a Page Title On every report page, there should be a clear title so that viewers know exactly what they are looking at.
- Use tooltips sparingly. Create bespoke tooltips that offer additional context when users mouse over data points – less clutter, more detail on demand.
Creating Several Report Pages
Group complex reports over numerous pages instead of trying to fit everything on a single canvas. Standard page layout:
- Executive Summary – KPI and trend charts at a high level
- Sales Analysis – revenue distribution by product, area and period
- Customer Analysis – segmentation, retention and life time value of customers
- Operations – efficiency measures, lead times and process performance
- Financial – P&L overview, margin analysis, budget vs actual
Step 7: Publish to Power BI Service
Build your report then upload to Power BI Service where you can make dashboards, share with colleagues and schedule automated data update.
Click Publish on the Home ribbon → select your target workspace → wait for upload to complete → Click the link to open in Power Bi Service.
Step 8: Build a dashboard in Power BI Service
Here’s the key difference that a lot of Power BI newbies miss: Power BI reports and dashboards are not the same.
Reports – interactive multi-page files developed in Power BI Desktop
Dashboards – single page canvases in Power BI Service, created by pinning visualizations from reports
To construct a dashboard:
- Open your published report in Power BI Service
- Hover on any visual you like on your dashboard
- Click on the pin symbol (📌) that you will see in the top right of the image
- Select New Dashboard (first pin) or Existing Dashboard (add to existing)
- Name your dashboard and select Pin
Repeat for each visual you want on your dashboard. Drag tiles on the dashboard canvas to resize and reposition them.
Dashboard Tiles
When you pin a visual, it appears as a tile on your dashboard. More tile choices:
- Text boxes – provide context, section titles or descriptions
- Images – add logos, icons or images that describe anything
- Web content – embed a URL (good for incorporating live webpages or web based KPIs)
- Streaming data tiles – Live monitoring use cases with real time data tiles
Dashboard versus Report: What’s the Difference, and When to Use Each
- Explore and analyze reports – interactive pages where users filter, drill down and study data.
- Use dashboards for monitoring – one-screen view of essential KPIs that stakeholders examine on a regular basis, without extensive engagement.
Step 9: Setup Automatic Data Refresh
Static snapshots get stale rapidly. Schedule automatic data refresh to keep your dashboard updated with the latest data.
In Power BI Service:
- Go to Datasets in your workspace
- Click the three dot menu next to your dataset → Settings
- Scheduled refresh → click to refresh
- Set time and frequency (Daily, Weekly)
- If your data source requires authentication, set up Data source credentials
Auto refresh requires a Power BI Pro license or Premium license. Only manual refresh is allowed on the free tier.
For on premise data sources (SQL Server, files on local disks) install and configure Power BI Gateway to allow scheduled refresh via the cloud service.
Step 10: Collaborate & Share
Share your dashboard with colleagues via Power BI Service:
- Direct sharing – Click sharing on the dashboard → type in email addresses → select if recipients can reshare or create new material
- Publish to an App – bundle several reports and dashboards into a Power BI App for easier dissemination to bigger audiences.
- Embed in Teams – add a Power BI tab to any Microsoft Teams channel to show dashboards right in team channels.
- Embedding in SharePoint – You can embed reports on SharePoint pages by using the Power BI web part to view them on an intranet.
- Export – export reports as PDF, PowerPoint or Excel for sharing offline.
Understanding Power BI Licensing
- Power BI Free – Desktop access, personal publishing, restricted Service features. No sharing with coworkers.
- Power BI Pro ($10/user/month) – sharing, collaboration, scheduled refresh. It is needed by both publisher and viewers to share material.
- Power BI Premium Per User ($20/user/month) – bigger data sets, enhanced AI capabilities, paginated reports and deployment pipelines.
- Power BI Premium Per Capacity – dedicated cloud resources for corporate size deployment Viewers don’t require Pro licenses.
If you want everything , Power BI Pro is a good deal at $10/user/month for most small to mid sized teams . It is a lot cheaper than the alternatives like Tableau .
Final Thoughts:
The path to building a Power BI dashboard is as follows: connect data → transform in Power Query → model relationships → create DAX measures → construct report graphics → pin to dashboard → share. They build on each other and the whole workflow from raw data to shared dashboard may be done in a matter of hours for a simple dataset.
The returns from investing in learning Power BI compound: each dashboard you design makes the next one faster and the business intelligence from well-built dashboards enables smarter decisions to be made at every level of an organization.
Frequently Asked Questions
1. Power BI report vs Power BI dashboard – What is the difference?
A multi-page interactive document, a Power BI report is generated in Power BI Desktop and provides full filter, slice, and drill-down features. A Power BI dashboard is a single-page, canvas-based report created in Power BI Service by pinning visualizations from one or more reports. Reports are used for analysis and analysis, dashboards are used for monitoring key data at a glance
2. You can construct dashboards without a paid Power BI license.
Power BI Desktop allows you to create reports for free. Power BI Service – to publish, share with colleagues and setup automatic data refresh you need a Power BI Pro license ($10/user/month). To share or view shared content, you need a Pro license (unless you’re utilizing Premium capacity).
3. What data sources does Power BI link to?
Power BI integrates to over 100+ native data sources, including Excel, CSV, SQL Server, Azure databases, SharePoint, Salesforce, Google Analytics, SAP, Oracle, MySQL, PostgreSQL, and hundreds more via authorized connectors. The Web connector makes REST APIs and web-based data available as well.
4. What is DAX and do I need to learn it to use Power BI?
DAX (Data Analysis Expressions) is the formula language used by Power BI to create calculated measures and columns. You can build simple dashboards with SUM, AVERAGE, COUNT and simple filters and without DAX. If you are doing intermediate to complex analytics like year over year comparisons, running totals, custom KPIs, time intelligence calculations then DAX expertise is a must and worth spending time on learning.
5. How to get my Power BI dashboard to update on its own?
In Power BI Service, set up the scheduled refresh by going to your dataset’s settings and turning on Scheduled Refresh using your desired frequency and time. Cloud data sources (Azure, SharePoint, Salesforce) credentials are entered in the Service. Install Power BI On-premises Data Gateway to enable cloud to on-premise connectivity for scheduled refresh for on-premise data sources (local SQL Server, files).

Enjoyed this article?
If this guide helped you, consider supporting Rough Diary. Your support helps us continue creating practical, informative, and useful AI and technology content.